


Contents
Scroll to:
 A. N. Nikanov,
S. A. Gorbanev,
V. M. Dorofeev,
V. P. Chashchin,
B. Lachein,
V. N. Fedorov,
Yu. A. Novikova
A. N. Nikanov,
S. A. Gorbanev,
V. M. Dorofeev,
V. P. Chashchin,
B. Lachein,
V. N. Fedorov,
Yu. A. Novikova https://doi.org/10.35627/2219-5238/2021-29-9-7-15
Scroll to:
Introduction: The relevance of the study is determined by the national goals of strategic development providing for sustainable population growth and an increase in active life expectancy, primarily in demographically disadvantaged areas to which most of the regions of the Russian Arctic Zone belong.
Objective: To assess changes in the demographic structure of the Murmansk Region, one of the most industrially developed regions of the Russian Arctic, and the loss of its labor potential in 1989–2019 in order to substantiate the necessity to consider these changes for better planning of health care and adjusting the resource provision of the regional health care system.
Materials and methods: We studied demographic characteristics of the population residing in administrative areas of the Murmansk Region with the main town-forming metals and mining enterprises by comparing data for 1989 with those for the years 1999, 2009, and 2015–2019 to establish trends in medical demography situation. The average age of the population was estimated as the arithmetic mean based on distribution of the population by age groups.
Results: We established a significant decrease in the size of population of the Murmansk Region in 1989–2019 (by 34.8 %) accompanied by changes in the demographic profile. The increase in the average age of the population was attributed to the sharp decline in the child population, a decrease in the number of people of working age (16–59 years), and a significant increase in the population of older age groups. Changes in the age structure of the population had a significant effect on the old age dependency ratio, which demonstrated a 2.7 and 3.2-fold increase over the three 1989-to-2019 decades in the region and its industrial monotowns, respectively.
Conclusion: The negative structural demographic trend resulted in a pronounced regressive regional age and sex pyramid, which by 2019 had a characteristic unstable shape with a relatively narrow base and a slope of its top to the left due to the significant predominance of the female population in the older age group. The observed changes in the demographic profile of the population suggest the need to consider this trend when planning local social policy including the volume and resource provision of health care services.
Nikanov A.N., Gorbanev S.A., Dorofeev V.M., Chashchin V.P., Lachein B., Fedorov V.N., Novikova Yu.A. Demographic Profile of the Population Residing in the Metals and Mining Areas in the European Part of the Arctic Zone of the Russian Federation. Public Health and Life Environment – PH&LE. 2021;29(9):7-15. https://doi.org/10.35627/2219-5238/2021-29-9-7-15
The relevance of the study is determined by the strategic task of sustainable population growth in the Russian Federation set by Presidential Decree No. 474, On the National Goals and Strategic Objectives of the Development of the Russian Federation up to 2030, issued on July 21, 2020. This task is of special importance for demographically disadvantaged areas including a vast majority of regions, which are part of the Arctic Zone.
At present, the issues of environmental monitoring in the Arctic territories and responding to human health and safety challenges in the changing Arctic climate, problems of human adaptation, especially of the indigenes, to these changes are being actively solved. Yet, the structure of risk factors, as well as climatic, geographic, and socio-economic conditions of the European and Asian parts of the Arctic differ significantly [1–7].
The Arctic Zone of the Russian Federation (AZRF) is fully or partially represented by administrative districts of nine northern constituent entities of the federation. Most minerals of strategic national importance are mined on the territory of the northern regions of Russia. The Murmansk Region situated on the Kola Peninsula is one of the most developed AZRF areas distinguished by its advantageous geographical location with the non-freezing water area of the seaport and large deposits of copper and nickel, rare earth, iron, apatite and nepheline ores and other minerals [8–15].
As in the vast majority of other AZRF districts of economic development, over 90 % of the population of the Murmansk Region live in towns and almost 30 % of townspeople are employed at such town-forming enterprises of the metals and mining sector as Apatite JSC, Kola Mining and Smelting JSC, Kovdorsky Mining and Processing Plant JSC, Olenegorsky Mining and Processing Plant, and Lovozersky Mining and Processing Plant JSC. Despite introduction of new technologies, high performance equipment and machinery, a significant part of mining and smelting workers are exposed to occupational risk factors, such as physical overload, noise, vibration, cold environment, dust and gas aerosols, and to hazardous working conditions, all contributing to high incidence of work-related and occupational diseases. It has established elsewhere [16–19] that adverse health effects of industrial pollution are usually observed in the general population residing in the vicinity of major industries.
The Murmansk Region is notorious for significantly higher mortality rates from the diseases potentially related to adverse occupational factors at core enterprises among the working-age male population and a more pronounced rising trend in the overall population mortality rate in metals and mining areas compared to other regions [20–22].
The objective of our study was to assess changes in the demographic structure of the Murmansk Region and the loss of its labor potential in 1989–2019 in order to substantiate the necessity to consider these changes for better planning of health care and adjusting the resource provision of the regional health care system.
We studied demographic characteristics of the population residing in administrative areas of the Murmansk Region formed by metals and mining enterprises including the towns of Apatity, Kirovsk, Monchegorsk, and Olenegorsk, Kovdorsky, Levozersky and Pechengsky districts.
We conducted a comparative analysis of data on the size and composition of the population in the study districts from the All-Union census of 1989 and those for the years 1999, 2009, and 2015–2019, to establish trends in medical demography situation. The average age of the population was estimated as the weighted arithmetic mean based on distribution of the population by age groups. We also estimated the share of old age population (60 years and over) in the total population (ratio of elderly), the ratio of old age population aged 60 and over to the population aged 0–59 years (aging rate), the ratio of elderly population to population aged 0–59 growth rates (aging index), and the dependency ratio for 1989– 2019. The obtained research data were processed in Microsoft Excel 2010 and the independent samples t-test was conducted.
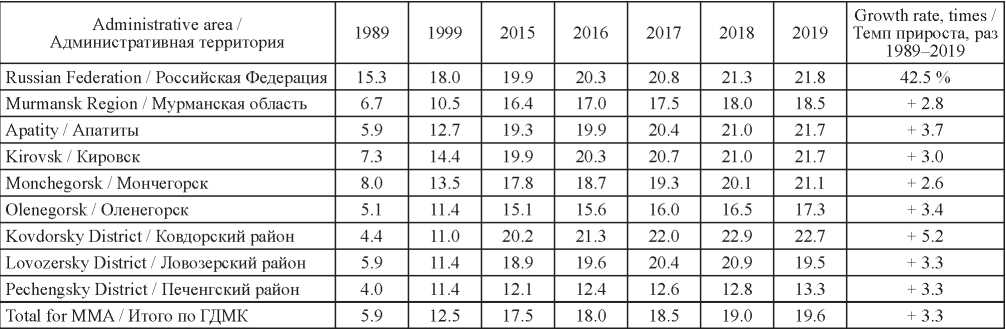
As of January 1, 2019, the size of population of the metals and mining areas (MMA) was 235.0 thousand people or 30.1 % of the total population in the Murmansk Region. If in 1989 the proportion of MMA population was 32.3 %, then in the early 1990s it gradually declined and equaled 29.5 % in the beginning of 1996. The rising trend was then registered in early 2000s resulting in 30.5 % in 2009, while in 2015–2019, the proportion of MMA population stabilized at 30.1 % of the total regional population (Table 1).
Table 1. The size of population in select administrative areas of the Murmansk Region as of January 1 of the specified year (thousands of people)
Таблица 1. Динамика численности населения отдельных административных территорий Мурманской области на начало соответствующего года (тысяч человек)
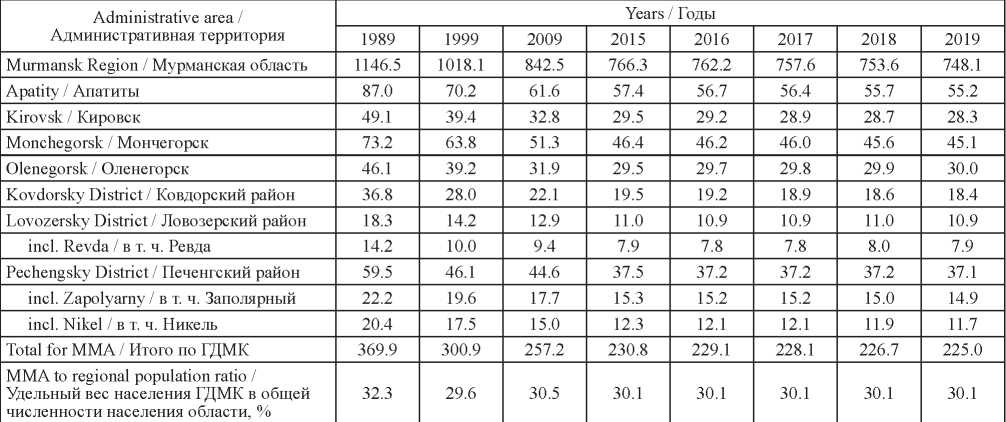
Note: MMA, metals and mining areas.
Примечание: ГДМК, горнодобывающий и горно-металлургический комплексы.
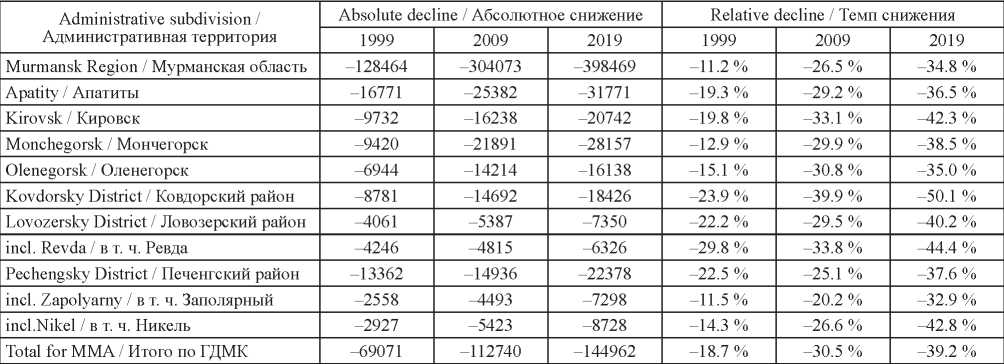
In 1989–2019, the size of population in the Murmansk Region decreased by 398.5 thousand people (–34.8 %) while in the MMA areas the population change amounted to –39.2 % ranging from –36.5 % to –50.1 % in certain administrative areas (Table 2). It should be taken into consideration that the maximum size of population in the Murmansk Region and in all MMA areas under study was registered in 1991, with the exception of Monchegorsky and Pechengsky Districts, where the decline was observed already in 1990. Thus, from 1991 to 2019, the size of population in the Murmansk Region and MMA areas decreased by 411 and 148 thousand people (–35.5 % and –39.7 %), respectively.
Table 2. The absolute and relative population decline in select administrative areas of the Murmansk Region compared to the year 1989
Таблица 2. Абсолютное снижение численности населения отдельных административных территорий Мурманской области по сравнению с 1989 годом и его темп
Over the past 30 years, the most intensive population decline in the metals and mining areas was observed in the 1990s with the annual rate of –1.87 % in 1989–1998, which was 67 % higher than the regional average. The most pronounced decline was registered in the Kovdorsky (–2.38 %), Pechengsky (–2.25 %) and Lovozersky (–2.22 %) Districts, in the towns of Kirovsk (–1.98 %), and Apatity (–1.93 %). In the following decade, from 1999 to 2008, the annual decline rate in the study areas was, on the contrary, 16 % lower than the regional average, constituting –1.45 %, with the highest rates in the Kovdorsky District (–2.1 %) and in the towns of Monchegorsk (–1.96 %) and Olenegorsk (–1.86 %). In 2015 2019, the annual rate of population decline in the Murmansk Region generally increased but did not change significantly in the metals and mining areas (t = 1.68). In 2017–2018, the regional and local decline rates were almost similar while in 2019, the decline was 21 % lower in MMA compared to the Murmansk Region (Fig. 1).
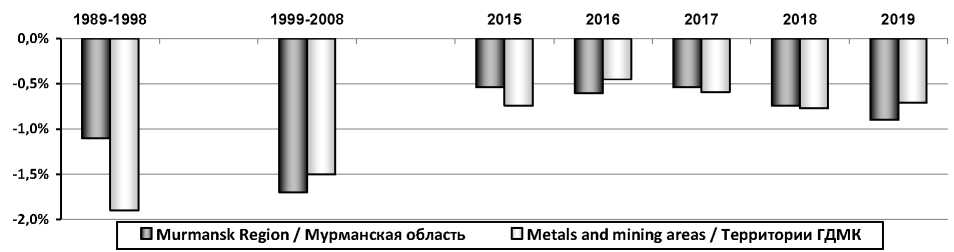
Fig. 1. Average annual rates of population decline (%), 1989–2019
Рис. 1. Динамика среднего ежегодного темпа прироста (снижения) населения (%) в 1989–2019 гг.
The population decline in the Murmansk Region was accompanied by significant changes in its structure as shown by the average age. In 2019, the population average age in metals and mining areaswas 38.5 years: slightly higher (0.8 %) than in the Murmansk Region and 1.9 % lower than that in the Russian Federation. In 1989, however, this indicator was 2.8 % and 15.9 % lower than the regional and national ones, respectively. In 2015–2019, the average age in MMA and the Russian Federation was not significantly different (t = 1.79). Compared to the Murmansk Region, the difference decreased as well (Fig. 2).
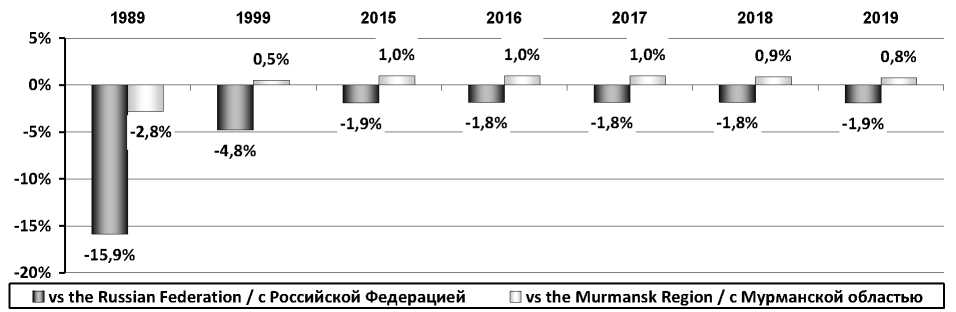
Fig. 2. Comparison of the population average age in metals and mining areas with those in the Russian Federation and the Murmansk Region (%), 1989–2019
Рис. 2. Динамика различий среднего возраста населения территорий ГДМК со средними в Российской Федерации и Мурманской области в 1989–2019 гг. (%)
In absolute terms, from 1989 to 2019 the average age of the population of metals and mining areas increased by 9.5 years (+32.8 %) from 29.0 to 38.5 years: by 7.7 years (+28.0 %) in men and by 11.1 years (+36.5 %) in women. The average age of the general population in the Murmansk Region and the Russian Federation over the same period increased by 28.1 % and 13.8 %, respectively. In 1989–2019, the highest growth rates were registered in the Kovdorsky (+41.7 %) and Lovozersky Districts (+39.1 %), the towns of Apatity (+33.4 %) and Monchegorsk (+33.1 %).
In 1989, in all the metals and mining areas, with the exception of the town of Kirovsk, the average age of the population did not exceed the regional value while 30 years later, in 2019, it was already higher in most of these territories, except the Pechengsky District and the town of Olenegorsk. The average age of the population in 2019 was higher than that in the Russian Federation in the Kovdorsky (40.3 years) and Lovozersky (39.4) districts, the towns of Apatity (39.5 years), Kirovsk (39.4 years), and Monchegorsk (39.3 years).
The reported increase in the median age of the population of the Murmansk Region between 1989 and 2019 resulted from a sharp decline in the child population, a decrease in the number of workingage people, and a significant growth in old age population. Structural changes in the population of the Murmansk Region were more evident than in the Russian Federation. We established that the decrease in the number of minors aged 0–16 by 31.0 % in the Russian Federation in 1989–2019 was accompanied by the decrease already by 55 % in the same age group of the Murmansk Region. An insignificant drop in the number of working-age people in the Russian Federation during this period (–2.9 %) was accompanied by a fall by 35 % in the Murmansk Region while the number of elderly increased by 40 % and 66 %, respectively. Between 1989 and 2019, the changes in the age structure were even more pronounced in the population of metals and mining areas where the number of minors and working-age people decreased by 64.0 % and 49 %, respectively, and old age population increased by 66 %. Besides, the decline rates in minors and elderly in the study areas exceeded the corresponding regional rates.
Dramatic aging of the population of the Murmansk Region is evidenced by dynamics and levels of old age and aging rates. In 1989–2019, the ratio of elderly in the Murmansk Region demonstrated a 2.8-fold increase and amounted to 18.5 % in 2019. The highest annual growth rate of this ratio in the Murmansk Region and MMA was in the 1990s: +5.2 % and +10.1 %, respectively. During the first decade of the 2000s, its annual growth rate dropped to +2.6 % and +1.6 % in the Murmansk Region and the metals and mining areas, respectively. In 2015–2019, the annual growth rate of the share of old age population in the Murmansk Region remained at the level of the first decade of the 2000s (+2.6 %) while in MMA it rose to + 2.4 %. Over the whole study period of 1989–2019, a 2.8-fold increase in the ratio of elderly in the Murmansk Region was accompanied by a 3.3-fold increase in all metals and mining areas and exceeded the average regional growth rate in all MMA except the town of Monchegorsk (+2.6 times). In 2019, the share of old age population in the Murmansk Region in general and the metals and mining areas was below the average for the Russian Federation. On the whole, the ratio of elderly in MMA in 2019 was 6 % higher than that in the Murmansk Region (Table 3).
Table 3. Population ageing: proportion of old age population (60 years and older), %
Таблица 3. Динамика старения населения, коэффициент старости, %
In 1989–2019, the aging rate in all metals and mining areas except the town of Monchegorsk also grew much faster than the average for the Murmansk Region. All major trends related to the increase in the regional and national aging rates and particularly that in the study areas matched changes in the share of old age population but were more vivid in the latter due to a simultaneous decrease in proportion of people under 60.
From 1989 to 2019, the average aging index amounted to 3.9 (range: 3.5–6.5) in the metals and mining areas against 3.1 in the Murmansk Region. The only exception was the industrial town of Monchegorsk, where this index equaled the regional average of 3.1. This finding means that from 1989 to 2019 the size of elderly population (aged 60 and over) in the metals and mining areas grew 3.9 times quicker than the size of population under 60.
The increase in the share of old age population and the corresponding decrease in the child population by 2019 resulted in a pronounced regressive age-sex pyramid in all territories under consideration. Changes in the age and sex distribution of the population of the Murmansk Region and the metals and mining areas as a whole and separately followed a similar pattern and differed only in their degree. Moreover, if in 1989 the age of the majority of working-age people ranged from 25 to 39 in all MMA, then in 2019, the proportion of people in the age groups of 25–59 years was almost similar for both sexes. The exception was the Pechengsky District, in which young working-age people still prevailed among the male population in 2019. The result of the above changes is the characteristic shape of age-sex pyramids of the Murmansk Region and its metals and mining areas with a relatively narrow base and a top tilted to the left due to a significant prevalence of old age female population in the general structure (Figs. 3, 4).
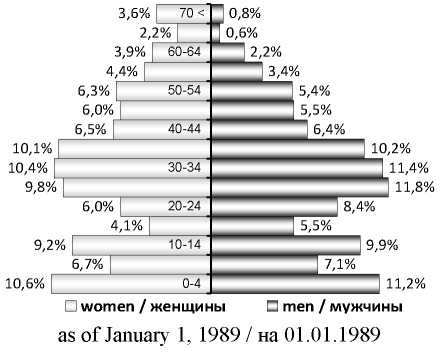
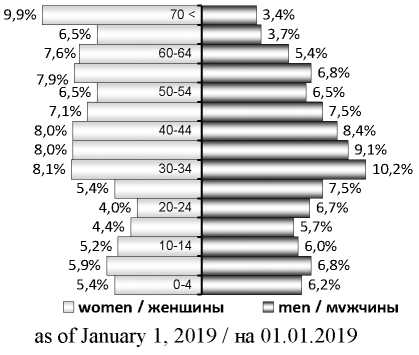
Fig. 3. The population pyramid of the Murmansk Region in the years 1989 and 2019
Рис. 3. Половозрастная пирамида населения Мурманской области в 1989 и 2019 гг.

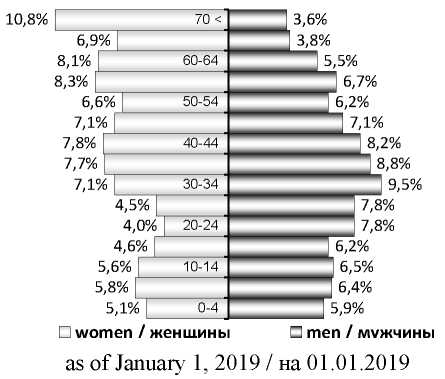
Fig. 4. The population pyramid of the Murmansk Region in the years 1989 and 2019
Рис. 4. Половозрастная пирамида населения Мурманской области в 1989 и 2019 гг.
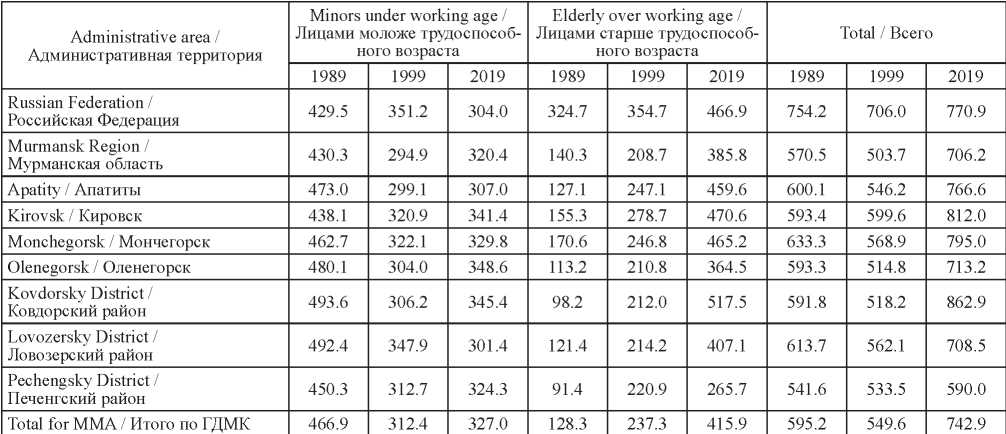
Changes in the age structure of population from 1989 to 2019 had a significant effect on the dependency ratio in the region. During the 1990s, the demographic burden of the working-age population was influenced by a dramatic decline in the child population while in the 2000s it was mostly affected by a continuous growth of the ratio of elderly. Compared to the year 1989, in 1999 the dependency ratio decreased in the Murmansk Region and all its metals and mining areas except the town of Kirovsk, where this indicator remained stable (t = 0.53), but in 2019 the dependency ratio increased both in the Murmansk Region (+23.8 %) and in all MMA from 9 % to 46 %. In 2019, this ratio exceeded the national average in the towns of Kirovsk, Monchegorsk, and in the Kovdorsky District, and the regional average in all metals and mining areas (from 1 % in Olenegorsk to 22 % in the Kovdorsky District), except for the Pechengsky District where the dependency ratio was 17 % lower and the Lovozersky District, where the difference from the regional average was not statistically significant (t = 0.39). The old-age dependency ratio grew very fast and in 2019 exceeded that of the year 1989 by 2.7 times in the region and by 2.7 to 5.3 times in the industrial areas (Table 4).
Table 4. Age dependency ratio per 1,000 working-age people
Таблица 4. Демографическая нагрузка на 1000 человек трудоспособного возраста
We established an intensive population decline in the Murmansk Region and its metals and mining areas. From 1991 (the year when the number of regional residents was the highest) to 2019, the size of population decreased by 411 thousand people (–36 %) in the Murmansk Region and by 148 thousand people (–40 %) in its towns and districts with the developed metals and mining industry. In the latter, the population decline was most prominent in the 1990s, when its rate was 67 % higher than the average for the Murmansk Region and resulted in the drop of the percentage of the local population from 32.3 % in the year 1989 to 29.6 % in 1999. In the following 10 years, the decline rate in MMA slowed down and was below the regional average, thus contributing to the increase in the proportion of the local population to 30.5 % in 2009. In 2010–2015, the population decline rate grew again and exceeded the regional rate by 40 % in 2015.
Over the final years of observation (2015–2019), the annual population decline rate grew in the Murmansk Region but did not change significantly in MMA (t = 1.68). At the same time, we saw no differences between the local and regional rates in 2017–2018 whereas in 2019, the annual decline rate in the metals and mining areas was already 21 % lower than the regional average.
The population decline in the Murmansk Region is accompanied by significant changes in its structure. In 1989–2019, the mean age of the population of MMA increased by 9.5 years (+33 %) to 38.5 years, which was 0.8 % higher than the average regional age and 1.9 % lower than the national average. If in 1989 the median age of the population in all studied areas except the town of Kirovsk did not exceed the regional average, then 30 years later, in 2019, it was already higher in most metals and mining areas, while in the Kovdorsky and Lovozersky Districts, the towns of Kirovsk, Apatity and Monchegorsk, the median population age in 2019 was higher than that in the Russian Federation.
The rise in the median age of the population in the north of the Kola Peninsula was induced by a dramatic decline in the child population, a decrease in the number of working-age people, and a significant increase in the size of elderly population. In contrast to the Russian Federation, structural changes in the population of the Murmansk Region were much more detrimental: from 1989 to 2019, the number of minors in the region decreased by 55 % against 31 %, the size of the regional working-age population declined by 35 % against 2.9 %, and the number of elderly people increased by 66 % against 40 % in the Russian Federation. Even more pronounced changes in the age structure were observed in the population of metals and mining areas, where the number of minors in the same period decreased by 64 %, working-age people – by 49 %, and the number of elderly increased by 66 %.
Since 1989, the share of old age population increased by 2.8 times in MMA and reached 18.5 % in 2019 while the aging rate rose by 3.9 times and amounted to 24.3 %. The size of elderly population (aged 60 and over) in the metals and mining areas grew four times faster than that of the population aged 0 to 59 in the same years.
The change in the age structure had a significant effects on the dependency ratio in the metals and mining areas in 1989–2019, which increased by 24.8 % despite the decline in the child population. We noted a significant growth of the old age dependency ratio over the 30 years between 1989 and 2019 by 2.7 times in the region and by 2.7 to 5.3 times in its developed industrial areas under study.
The result of the negative structural demographic trend was a sharply expressed regressive age-sex pyramid, which by 2019 had a specific unstable shape with a relatively narrow base and a slope of its top to the left due to the significant predominance of the elderly female population in all studied territories. Demographically, a gradual increase in the proportion of elderly people has a significant effect on reproductive patterns, age and sex structure, birth rate, etc. Economically, these changes inevitably lead to a decrease in the workforce and an increase in the dependency ratio, thus creating problems in the development of social production. From a social point of view, aging necessitates additional care for old people, whose number is growing very rapidly, and higher expenditures of the society for support and servicing of the elderly [13, 16, 20]. Thus, the analysis of the size and structure of population is a prerequisite for developing public health measures and planning resources for health care. The observed significant changes in the demographic profile of the population suggest the need to take this trend into account when establishing social policy in the districts under study, including the volumes and resources of health care services.
1. Vasiliev VV, Selin VS. [Methodology of the Integrated Natural and Economic Zoning of the Northern Territories and the Russian Arctic.] Apatity: RAS Kola Science Center Publ., 2013. (In Russ.)
2. Кarnachev IP, Nikanov АN, Koklyanov EB. Level of regional social and economic development and labor safety indicators in Murmansk region. Ekologiya Cheloveka [Human Ecology]. 2012;(7):19–23. (In Russ.)
3. Kovshov AA, Novikova YuA, Fedorov VN, Tikhonova NA. Socio-economic portrait and medical and demographic characteristics of the Arctic territories of the Republic of Sakha (Yakutia). Rossiyskaya Arktika. 2021;(2(13)):105–117. (In Russ.) doi: 10.24412/2658-4255-20212-105-117
4. Leksin VN, Porfiriev BN. The Russian Arctic: The logic and paradoxes of change. Problemy Prognozirivaniya. 2019;(6(177)):4–21. (In Russ.)
5. Popova ON, Shcherbina YuF. Climatic-geophysical characteristics of Kola Arctic region. Ekologiya Cheloveka [Human Ecology]. 2012;(5):3–7. (In Russ.)
6. Chashchin VP, Gudkov AB, Popova ON, Odland JO, Kovshov AA. Description of main health deterioration risk factors for population living on territories of active natural management in the Arctic. Ekologiya Cheloveka [Human Ecology]. 2014;(1):3–12. (In Russ.)
7. Gudkov AB, Popova ON, Nebuchennyh АА, Bogdanov МYu. Ecological and physiological characteristic of the Arctic climatic factors. Review. Morskaya Meditsina. 2017;3(1):7–13. (In Russ.) doi: 10.22328/2413-5747-2017-3-1-7-13
8. Gorbanev SA, Fedorov VN, Tikhonova NA. State and improvement of sanitary and epidemiological welfare management in the Russian Arctic. Ekologiya Cheloveka [Human Ecology]. 2019;(10):4–14. (In Russ.) doi: 10.33396/1728-0869-2019-10-4-14
9. Kachurin NM, Efimov VI, Koklyanov EB, Кarnachev IP, Nikanov АN. [Injuries and Occupational Diseases in Underground Miners.] Tula: Tula University Publ., 2012. (In Russ.)
10. Кarnachev IP, Efimov BV, Nikanov АN. [Ensuring Occupational Safety in the Production Sector (on the Example of Industrial Enterprises of the Mining and Energy Complex of the Kola Arctic)]. Apatity: RAS Kola Science Center Publ., 2006. (In Russ.)
11. Syurin SA, Burakova OA, Nikanov AN, Leshtaeva NR, Chashchin VP. The health of apatite-ore miners in High North. Zdorov’e Naseleniya i Sreda Obitaniya. 2010;(12(213)):23–27. (In Russ.)
12. Burström L, Aminoff A, Björ B, et al. Musculoskeletal symptoms and exposure to whole-body vibration among open-pit mine workers in the Arctic. Int J Occup Med Environ Health. 2017;30(4):553–564. doi: 10.13075/ijomeh.1896.00975
13. Jussila K, Rissanen S, Aminoff A, et al. Thermal comfort sustained by cold protective clothing in Arctic open-pit mining – a thermal manikin and questionnaire study. Ind Health. 2017;55(6):537–548. doi: 10.2486/indhealth.2017-0154
14. Laruelle M, Esau I, Miles V, et al. Arctic cities as an anthropogenic object: a preliminary approach through urban heat islands. Polar J. 2019;9(2):402-423. doi: 10.1080/2154896X.2019.1685171
15. Nieminen P, Panychev D, Lyalyushkin S, et al. Environmental exposure as an independent risk factor of chronic bronchitis in northwest Russia. Int J Circumpolar Health. 2013;72(1):19742. doi: 10.3402/ijch.v72i0.19742
16. Gambarian MG. Epidemiological features of chronic respiratory diseases in a number of regions of the Russian Arctic with developed industry. Profilakticheskaya Meditsina. 2014;17(6):71–78. (In Russ.)
17. Syurin SA, Kovshov AA. Working conditions and occupational morbidity at mining and metallurgical enterprises of the Murmansk Region. Zdorov’e Naseleniya i Sreda Obitaniya. 2020;(1(322)):34–38. (In Russ.) doi: 10.35627/2219-5238/2020-322-1-34-38
18. Tikhonova NA, Novikova YuA, Kovshov AA, Fedorov VN. [Analysis of medical and demographic indices and health status of the population in hard-to-reach areas of the Arctic zone of the Russian Federation on the example of the Nenets Autonomous Okrug.] In: Proceedings of the Tenth All-Russian Scientific and Practical Conference with International Participation “Health Risk Analysis–2020” in conjunction with the International Meeting on Environment and Health “Rise–2020” and a Round Table on Food Safety. Popova AYu, Zaitseva NV, eds. Perm: Perm National Research Polytechnic University Publ., 2020:386–391. (In Russ.)
19. Shcherbina FA, Shcherbina AF, Shcherbina YuF. [Human Breathing in the Arctic during the Seasons of Light Aperiodicity.] Arkhangelsk: Murmansk Arctic University, 2018. (In Russ.)
20. Dorofeev VМ. [Features of Disease Incidence and Medico-Demographic Processes in the Kola North.] Cand. Sci. (Med.) Thesis. Saint Petersburg, 1996. (In Russ.)
21. Kovalyov IV, Dorofeyev VМ, Krivosheyev YuK, Nikanov АN, Shukin ОN. Demographic problems and reproductive health of women and infants. Meditsina Truda i Promyshlennaya Ekologiya. 2004;(2):10–14. (In Russ.)
22. Revich BA, Kharkova TL, Kvasha EA, Bogoyavlensky DD, Korovkin AG, Korolev IB. [Demographic Trends, Workforce Dynamics and Health Risks for the Population of the European Part of the Russian Arctic.] Moscow: Editorial URSS Publ., 2016. (In Russ.)
Alexandr N. Nikanov, Cand. Sci. (Med.), Head of the Clinical Research Department
4 2nd Sovetskaya Street, Saint Petersburg, 191036, Russian Federation
Sergey A. Gorbanev, Dr. Sci. (Med.), Director
4 2nd Sovetskaya Street, Saint Petersburg, 191036, Russian Federation
Vitaliy M. Dorofeev, Cand. Sci. (Med.), Head of Organizational and Methodological Office, Clinical Research Department
4 2nd Sovetskaya Street, Saint Petersburg, 191036, Russian Federation
Valery P. Chashchin, Dr. Sci. (Med.), Professor, Honored Scientist of the Russian Federation, Chief Researcher; chief researcher; professor
4 2nd Sovetskaya Street, Saint Petersburg, 191036, Russian Federation
41 Kirochnaya Street, Saint Petersburg, 191015, Russian Federation
20 Myasnitskaya Street, Moscow, 101000, Russian Federation
Barbara Lachein, Professor
2 Forsthausweg, Duisburg, 47057, Germany
Vladimir N. Fedorov, Research Assistant, Analysis, Evaluation and Forecasting Section, Arctic Environmental Health Department
4 2nd Sovetskaya Street, Saint Petersburg, 191036, Russian Federation
Yuliya A. Novikova, Head of the Analysis, Evaluation and Forecasting Section, Arctic Environmental Health Department
4 2nd Sovetskaya Street, Saint Petersburg, 191036, Russian Federation
Nikanov A.N., Gorbanev S.A., Dorofeev V.M., Chashchin V.P., Lachein B., Fedorov V.N., Novikova Yu.A. Demographic Profile of the Population Residing in the Metals and Mining Areas in the European Part of the Arctic Zone of the Russian Federation. Public Health and Life Environment – PH&LE. 2021;29(9):7-15. https://doi.org/10.35627/2219-5238/2021-29-9-7-15
ЖУРНАЛ В СОЦСЕТЯХ
![]()
![]()
.png)
PH&LE Editorial Office
Federal Center for Hygiene and Epidemiology
19A Varshavskoe Shosse, Moscow, 117105, Russian Federation


